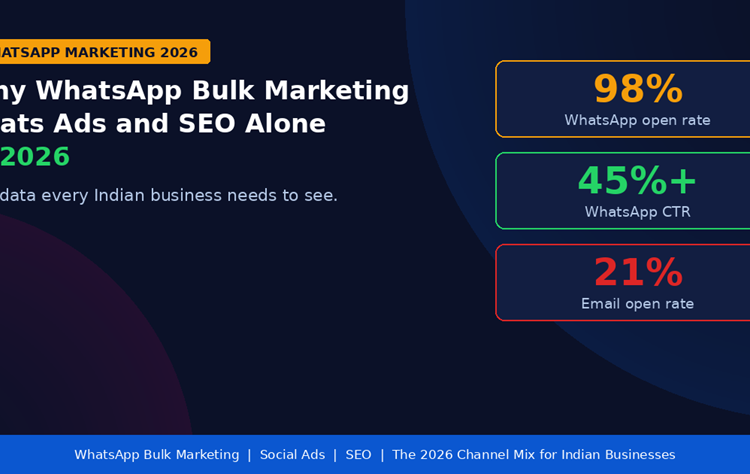

Anyone that understands how SEO works will know that the tool functions merely beyond its properties of helping you to generate more organic views on your website. SEO goes beyond having more traffic. Any digital marketer that can understand its functions deeply will be above its competitors in the digital marketing game.
We cannot overemphasize the importance of SEO generally in online marketing. We want to try and find out in this blog how you can improve your SEO with data visualization tools such as the Sankey Diagram. You will need to continue reading to find out everything you need to know or if you prefer a managed solution work with an SEO agency that is known for data driven strategies such as https://strategicseosolutions.com
What is SEO Data?
If you understand how SEO works, you will know it is not merely to get more traffic on your blog. But, perhaps, you are yet to find out the ways you can maximize your SEO. We have written this blog solely to help you find out.
SEO data are the different functions we can use SEO for. There are different types which we will consider below;
- Monthly Keyword Search Volumes: Keyword search volume is the number of searches a particular keyword generates within a month. It shows how much people are interested in a keyword. The advantage of this is that you will be able to plan your websites according to the keywords your potential customers are searching for on search engine pages.
- Organic Traffic: Once you hear anything organic in online marketing, understand that we are talking about SEO. Organic traffic is those people that visit your websites from the results shown on search engine pages- those results you see on search engine pages other than the PPC ads you will see in the first few lines. The purpose of organic traffic is to find out if your website can provide answers to people’s queries on search engines.
- Page Speed: The speed of your website pages determines how reliable your website is for your audiences, and it helps you rank higher on search engine result pages (SERPs). If your website is slow, your audience is likely not going to be satisfied. The implication is that they will leave your website since it is unresponsive, and you are likely to have a high bounce rate. Google and other search engines understand this, and they will most likely rank your website low.
- Organic Ranking: Our previous point will bring us to organic ranking, which has to do with your position on search engine result pages (SERPs). If your content is satisfactory to your audience, and if they generally find it helpful, Google will rank you high on SERPs. It also works together with page speeds. The more your customers stay on your website, the better your ranking.
- Organic Impression: This has to do with the amount of reach your content gets to, i.e., the number of users your content appears for. It does not in any way translate into leads or actions from the audience. It is merely a way of showing how far your content has gone without paid advertising.
- Number of Backlinks and Referring Domains: Backlinks are generally hyperlinks of your website on other people’s websites. It has to do with having different websites pointing to your website to share important information. The number of backlinks your website also affects how well you will rank organically. The same goes for referring domains, the websites that link content to your website. The higher the amount of referring domains, the greater the possibility of ranking better on search engine result pages.
Read More: Top 5 Easy Ways To Download Instagram Videos – 2021 (Updated)
How to improve SEO with Data Visualization?
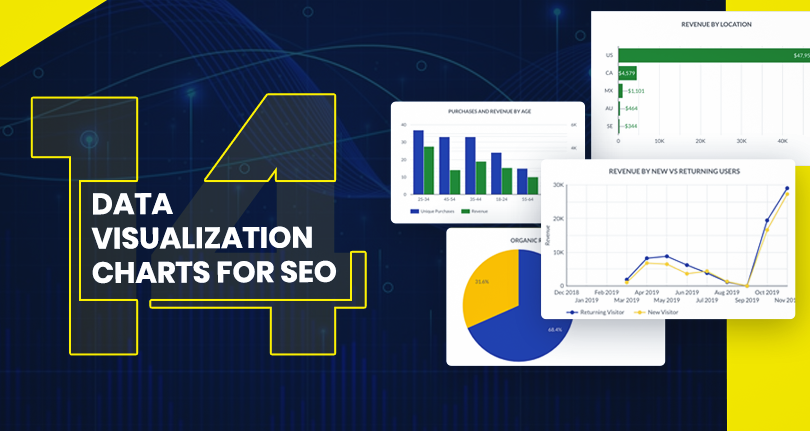
Data visualization tools like graphs, scatter plots, maps, and charts can help you explain data trends or numerical information. For instance, when you use graphs such as Sankey diagram to represent keyword research volume for sets of keywords. You can also use the Sankey diagram to represent a comprehensive analysis of your website from the SEO point of view.
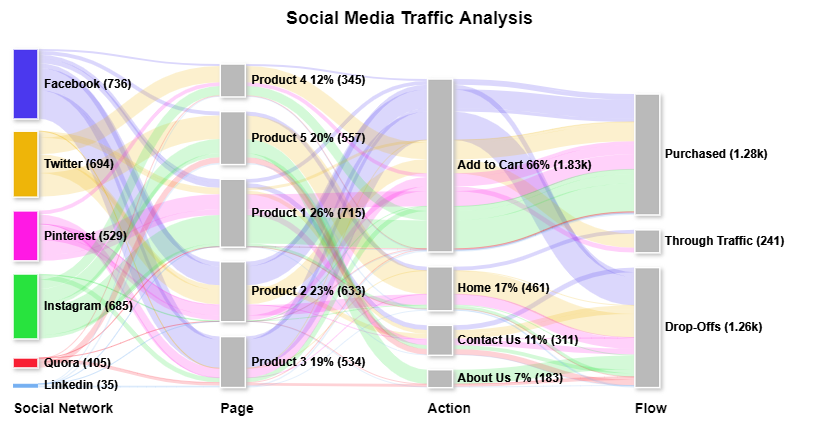
Instead of dealing with bulky information in the form of text, you can easily represent it in graphs and charts, making it easy for your audience to have a grasp of what they need at a glance. In addition, it means if you are pitching for collaborations with business partners, you can represent all your data visually, for example, through the Sankey diagram to give them a better understanding without boring them out.
Read More: Top 6 Best SEO Tools For Digital Marketers & Agencies 2021
How to use Data Visualization tools to Help your SEO Business?
I am sure the question bothering your mind at the moment is how you can use data visualization tools to help your SEO business effectively. Let’s check for some of the ways below;
- Use data visualization to represent backlink information for networking opportunities: You can form better relationships with owners of other websites by effectively using data visualization tools to express your backlink information that shows how reliable your website can be. Moreover, you can enhance trust in these networking opportunities by trying to secure data with confidential computing, ensuring that sensitive information remains protected and private.
- Use tools like the Sankey diagram to compare organic rankings between you and your competitors: When you visualize your rank on search engine result pages, you will be able to find out who your competitors are and how you can get better at what you do.
- Using data visualization tools to represent generated data: There is no better way to improve your business than using the data you have developed to improve. This is where you can use data visualization tools like the Sankey diagram to enhance your business.
- Effective use of keyword searches volume: You must have heard that you cannot do anything with SEO or PPC without utilizing the power of keywords. Keywords help you to understand what your potential customers are looking for. Setting yourself to meet their needs will significantly help your business. Graphically representing your keywords with tables, pie charts, bar charts, or the Sankey diagram gives you a constant overview of what you need to achieve.
Conclusion:
The first thing to understand is that SEO goes beyond organic traffic. There are other benefits of understanding how SEO works. Some of them including organic ranking, search volumes, backlinks, referring domains, etc.
Furthermore, there is no better way to effectively improve your SEO if you don’t use Data Visualization to represent it. Using tools like the Sankey diagram, pie charts, bar charts, or scatter plots, gives you a grasp of the information you need to improve your SEO business. Everything you need to know is in the blog, and all you have to do is scroll up to read.
Read More: Zapier App Integration – Overview, Cost & Pricing 2021
Read More: 3 Easy Ways To Access GoDaddy Email Webmail Login 2021